Today is common sense, but not common practice. Especially not common practice when dealing for students who are just learning to program.
Generally they treat the IDE as a glorified text editor. Yes it is that, but it has a lot more to offer then just that.
This post of focusing on one single point. What to do when the program crashes & how to use the diagnostic tools to isolate the cause of the crash.
The crash
We have all seen this often enough:
This is the error which the operating system kicks up if your program crashes. It also means that you forgot to turn on the debugger, as normally when you are developing the debugger should have caught it before it got here.
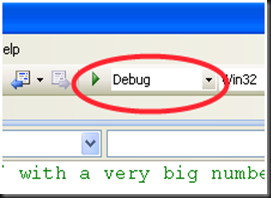
This is what you should have done. Set debug mode & use the green arrow (run in debugger). If you are a keyboard shortcut person, that’s F5. Do not use Control+F5, as that runs without the debugger. So try running your program again, this time with the debugger.
Sometimes you might get a window like this:
If so, take its advise & press ‘retry’, this will get the debugger helping you to find the error.
Take note of the symptoms
If you visit the doctor, they don’t just give you medicines do they? First they check your temperature, blood pressure & ask you what is wrong with you. So let’s do the same for our program. Here are the symptoms.
The 0x004117f9 is not useful, that’s the part of the code that failed (our debugger can tell us about that later). But the other bit is interesting. 0x00000000 is the classic null pointer, in fact based upon my own experience, any values 0x000...0x007 or so are likely to be a null pointer somewhere.
At this point we move on, press the ‘break’ key to pause the program, but DO NOT, press the stop button. I’m shocked how often students just immediately stop the program when it crashes & charge off guessing where the crash is. “Hey, Mac! The information is right there, just look at it!”
Call stack is your friend
99% of the time, you can get an almost perfect answer on what went wrong by looking to the call stack. If you cannot see it when debugging, try
Debug->Windows->Call Stack. You will see something like this:
There it is, a list of all the functions called. If you want, you can double click on each/all of the functions listed there and the IDE will bring you to the correct point of code where it was.
| Tip: It’s never <insert name of library here>’s fault A common mistake is to look at stack trace & say ‘but it crashed in the XXX library, the library must be broken’. It’s not broken, it’s almost certainly you called the library with some bad values & it crashes. If the crash appears to be in the library code, move back the stack trace until you hit your code & then start looking around there. You will find rubbish being sent into the library. |
Check your values
So we know where it crashes, what were the values passed in? Try highlighting the values, the IDE will pop up a tooltip with its current value.
The other place you can look is the auto’s window, which lists all the variables that the IDE thinks might be useful (Debug->Windows->Autos)
In this particular case, it looks like there might be something wrong with the ‘this’ variable (its a null).
If you are not sure, try going the stack trace & moving up a level & see what the context of calling the function was.
Ah, here we are. Someone called f->set(), but the issue is that f is a not a good value (its zero).
| Tip: Good values vs Bad values With practice, you learn what good values & bad values should look like. A score of -124324 is obviously a bit strange. But here are some thoughts on values: For normal variables, large values (>10,000 or <-10,000) are probable incorrect. Pointers are usually 0x0000 or some strange number which refers to a point in memory. Instead of looking at the pointer, look at the value of the object its referring to |
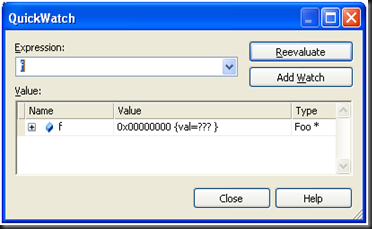
Another handy trick which can be done is to watch a variable, so you can keep an eye on it as it changes. This can be done with ‘Right Click->Add Watch’ or
‘Right Click->Quick Watch’.
Crashes in STL
As mentioned in one of the boxes above, just because the code crashes in a library doesn’t mean it’s not your fault. A common example of this is accessing off the end of an array when using STL’s vector class. Normally you will get an error like this:
Don’t just hit return & abort, instead press the retry button & debug. The IDE will then bring you to a line of code in the middle of STL which you will not be able to understand (trust me: I find reading STL source code a headache, you don’t want to do it).
Instead of throwing up your hands in annoyance and giving up, call up the stack trace & search through it until you get back to your code.
Once you have got back to your code, you will be able to start checking all the variables to find the cause of the issue and what made the code crash.
In this case, its writing to v[10], when v is only 5 units long.
Crashes when deleting
This is probably one of the nastiest errors to debug. It’s when nearing the end of the program, you start deleting everything and the code crashes. You end up with an error like this:
Again it’s retry to debug, but it will be harder to spot what went wrong, as at this point things are being shutdown.
A general guess on this kind of error: is to check for a double delete. However sometimes errors like this can be caused by wandering off the end of an array. When the delete occurs, the IDE detects there is something wrong, but is not able to tell you what. But at least it has narrowed down to a class/array to check.
Conclusion
We could write more on this, there are probably books debugging. But here are a few simple bits of common sense which you can use when the program crashes.
Don’t just stop the program, instead look at where is crashed and why. You can probably guess from there what went wrong.
I won’t say ‘happy debugging’, as C++ debugging is rarely a happy event, but this might help a few of you be able to debug a little better.
Mark


No comments:
Post a Comment